A newly released, AI-powered tool now provides access to state assessment data from all 50 states and Washington, D.C. to parents, educators, and policymakers.
Zelma, a collaboration between Brown University and Novy, enables users to access real-time insights and visual representations of student performance data through charts, graphs, and tables.
The developers claim that the app allows users to interactively search and retrieve data, in a manner similar to a search engine or chatbot. The available data includes math and English language arts assessments for grades 3 to 8. However, there is currently no performance data for high school level.
Student loan debt: Some parents who took out parent PLUS loans for their children’s college education anticipate carrying that debt until their death.
What does the app display?
While every state is mandated to participate in standardized testing, accessing the results can be challenging. Not all results are available online, and they are not uniformly presented. Zelma aims to bridge this data gap by allowing users to compare subgroups such as gender or race/ethnicity within a state or school district. Users can also explore district outcomes across subjects over time.
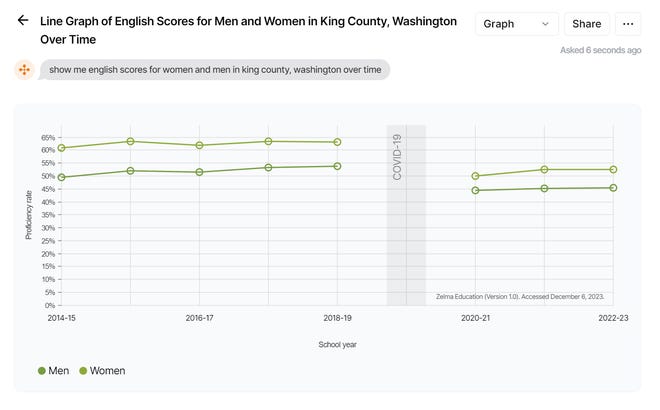
For instance, if a teacher in Seattle Public Schools wants to see the English performance scores for female students in the county, they can request: “Display the English scores over time for men and women in King County, Washington.”
Zelma is an extension of the COVID-19 School Data Hub, which is led by Dr. Emily Oster, a professor at Brown University.
Oster emphasized that educators, parents, and state officials should all have access to information about their local school systems. “I’m thrilled about Zelma’s potential in increasing data literacy, enhancing our collective understanding of school performance, and informing efforts to support students nationwide,” shared Oster.
Test scores in the US: The COVID pandemic has had a significant impact on education in the US and worldwide, leading to unprecedented setbacks.
It’s not as simple as ABC: Some schools are adopting new methods of grading students.
Where is the data sourced from?
The assessment data is obtained from all 50 states and Washington, D.C. for students in grades three through eight. The data is collected from individual state education agencies and covers over 13,000 school districts. However, the availability of data varies among states, with some not reporting data by race/ethnicity.
It should be noted that the assessment data cannot be directly compared across state lines due to distinct assessments based on specific standards administered by each state. Instead, users can identify trends and outcomes within the same state across different districts and schools, according to Zelma.